In the next sections of the course, we will discuss many methods for producing saliency maps. These can provide great insight into complex deep learning models. However, when interpreting them, we must always be aware of their limitations. Otherwise, you may make incorrect decisions or provide incorrect explanations to end users.
Before you get stuck into the article, here is the video version of the lesson.
We’re going to discuss the most common limitations and pitfalls of using XAI methods. This includes overestimating their ability, misunderstanding their technical assumptions and interpreting the output in a biased way. But first, to put these limitations into context, we will need to take a step back and understand…
What is XAI?
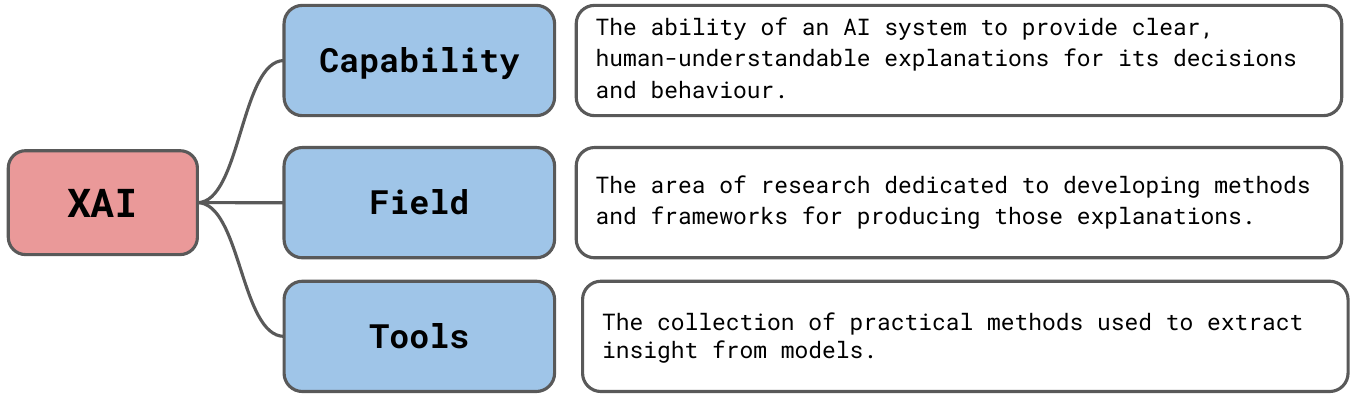
Like many terms in machine learning, XAI can have multiple meanings which can be used interchangeably. We see these in Figure 1. Let's start with the most demanding definition:
Explainable Artificial Intelligence (XAI) is the ability of AI systems to provide clear and understandable explanations for their actions and decisions. Its central goal is to make the behaviour of these systems understandable to humans by elucidating the underlying mechanisms of their decision making processes.
— EDPS TechDispatch on Explainable Artificial Intelligence [1]
This is an ambitious goal. It essentially requires a broad explanation of a system's abilities (what it can and can't be used for), its actions (past decisions, present processes and future steps) and all the relevant data and information it uses to make those actions [1]. It also requires us to provide this explanation in a way that a layman is able to understand. It is at this point that we move away from computer science and require help from fields like psychology and sociology.
We can also think of XAI as the field of study dedicated to producing these explanations. Another definition is simply the collection of tools we have at our disposal for providing these explanations. We should acknowledge that these tools are often not used to provide human-friendly explanations but to provide insight into models for data scientists and AI researchers. Insight that can be used to debug and improve the model development process.
It is this latter definition that we focus on in this course. More specifically, we focus on explaining various methods for developing saliency maps. Although these can be an important part of the wider goal of XAI, they are not enough to provide these more thorough explanations. This is why sometimes we refer to their insights as interpretations.
Ultimately, this should be considered a limitation of the information in this course and our first limitation of saliency maps. Within this more narrow focus, saliency maps will have additional limitations. Many of these are unique to specific methods, but as we will see, there are a few limitations they will all share.
Four limitations of saliency maps
Limited reliability and faithfulness
We discuss the properties of reliability and faithfulness in the lesson on Evaluation and Axioms. The former is about providing explanations that are stable and practical. The latter is about explanations that accurately explain the model's true decision-making process.
There is an inherent trade-off in these desirable properties. For an explanation to be reliable, it must summarise the model's internal workings to an extent. Otherwise, it will not provide useful information. Doing so ultimately means it cannot be 100% faithful. So a key limitation is that all methods will vary in the degree to which they are reliable and faithful. The real problem is that these properties are difficult to quantify.
As we've seen, no method can satisfy all desirable axioms. Additionally, the empirical approaches to evaluate them all have their own limitations. The result is an unknown uncertainty. We cannot be sure if an explanation is correct or how likely it is to be incorrect. Ultimately, we should also be aware that any method could produce unfaithful explanations.
Causal inference
Even if we could develop a method that was 100% faithful, we must be aware that it cannot reliably be used for causal inference. This is the process of finding the true causes of an event/target. Saliency maps can tell us how each model feature has contributed to a prediction. They do not tell us how the features contributed to the ground truth. This is because a model is not necessarily a good representation of reality.
SHAP is not a measure of 'how important a given feature is in the real world', it is simply 'how important a feature is to the model'
—Gianluca Zuin
Predictions can be incorrect. In this case, XAI will give the contributions to a prediction that is not the same as the true target. Even if the model is 100% accurate, it could be using proxy variables. For computer vision, these are pixels that are only correlated with the class. We saw this in the importance lesson where the pot plant detector was using the wrong information to make a correct classification. Another classic example is the model that uses snow to classify images of wolves [2].
These show us examples where we have been able to identify bugs in a model. Likely, we would never conclude that the colour of a plant's pot determines its type or that if a husky is in snow, it becomes a wolf. Yet, there can be many more subtle correlations like this where we may be fooled into believing a causal relationship exists. Although XAI can help identify causal relationships, this fact means we need additional approaches to be sure.
Technical assumptions
Models can be incorrect for many reasons. This can lead to unexpected explanations. We need to consider another layer of technical difficulties, and those are mistakes in XAI methods themselves. By this, we mean the various technical assumptions or quirks that can undermine reliability and faithfulness.
Here are some key technical assumptions and limitations:
- Feature Independence: Many perturbation methods like occlusion, LIME and KernelSHAP assume features are independent.
- Baseline/Reference Selection: Methods like Integrated Gradients and DeepLIFT require choosing a baseline that theoretically represents a neutral input providing zero information to the model.
- Linearity: Many gradient-based methods like Vanilla Gradients and Guided Backpropagation assume a model behaves locally linearly around the input.
- Out-of-distribution perturbations: Both perturbation and baseline methods require us to provide altered versions of sample images as input into the model.
Feature independence is particularly concerning for image data, as neighbouring pixels are inherently dependent. Changing an individual pixel may have different consequences on its importance than if you changed it in combination with other pixels. Similarly, the linearity assumption means that if we change a pixel's values, then we expect to see a change that is proportional to the pixel's gradient. However, the relationship between a pixel's value and the output will often be non-linear. This is due to various interactions and non-linear functions in a network.
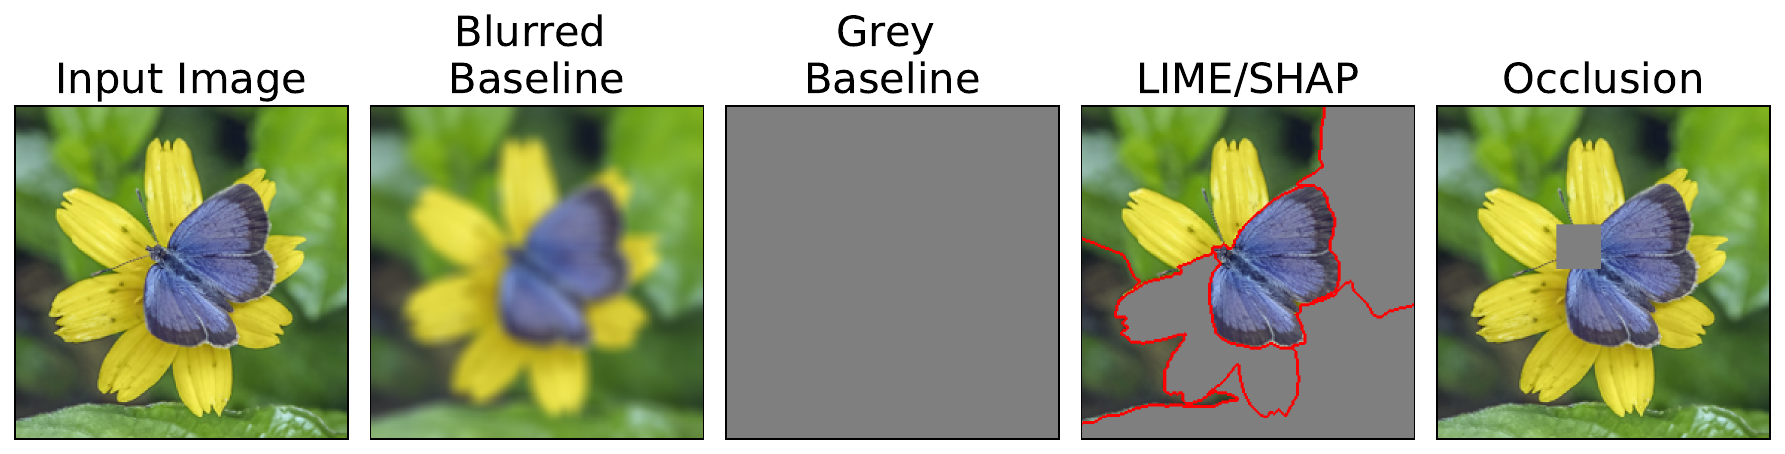
Baseline methods can avoid these limitations. However, baseline selection can be difficult in practice. It could be a black, grey, blurred or noisy image. However, different baselines could produce different or even contradictory explanations for the same prediction. Like perturbation methods, they can also produce out-of-distribution samples. This means we are using images, like those in Figure 2, that the model never saw during training. Any changes in a model's prediction may be due to it struggling to make a prediction, rather than removing important information.
This takes us back to limitation 1. The reason many of these assumptions are made is to reduce computational complexity and to summarise model behaviour in a way that provides practical information for humans. The good thing is that at least we are aware of these and can analyse explanations appropriately. One of the more insidious problems is flaws in our own thinking.
Human error
From technical analysis to astrology, humans love to find patterns that aren't really there. Data science is no different. When analysing saliency maps, we can create false narratives. We can force these stories onto the analysis even if they come from model or method quirks. We can do this unconsciously as a result of confirmation bias. It can also be done maliciously to support a conclusion that will benefit someone.
This problem is made worse by some of the technical limitations. For example, we could cycle through different baseline images until we have a saliency map that "looks right" to us. However, this result could be due to random chance. Similarly, we could adjust occlusion parameters, change the layer we focus on when using Grad-CAM or even just use a different explanation method. These approaches are all examples of p-hacking—we torture our data and models until they give us the results we want.
In the end, all of these limitations should increase your scepticism around conclusions made using XAI. We must be aware of the unknown uncertainties around reliability and faithfulness and the various technical and human errors that can add to it. Never accept conclusions that go beyond the model—especially if it supports an ulterior motive. All this is especially true if your goal is to go beyond model development and provide human-friendly explanations.
Challenge
One way to avoid this last bias is to apply multiple XAI methods to the same image. If they all lead you to the same conclusion, you can be more certain it is correct. So, the challenge is to select three or four of the methods from the next sections and apply them to the same model and image. Do they produce similar saliency maps?
I hope you enjoyed this article! See the course page for more XAI courses. You can also find me on Bluesky | YouTube | Medium
Additional Resources
- YouTube Playlist: XAI for Tabular Data
- YouTube Playlist: SHAP with Python
Datasets
Conor O’Sullivan, & Soumyabrata Dev. (2024). The Landsat Irish Coastal Segmentation (LICS) Dataset. (CC BY 4.0) https://doi.org/10.5281/zenodo.13742222
Conor O’Sullivan (2024). Pot Plant Dataset. (CC BY 4.0) https://www.kaggle.com/datasets/conorsully1/pot-plants
Conor O'Sullivan (2024). Road Following Car. (CC BY 4.0). https://www.kaggle.com/datasets/conorsully1/road-following-car
References
- Bernardo, Vitor (2023). TechDispatch: Explainable Artificial Intelligence. Publications Office of the European Union.
- Ribeiro, Marco Tulio, Singh, Sameer, Guestrin, Carlos (2016). Why should i trust you? Explaining the predictions of any classifier. Proceedings of the 22nd ACM SIGKDD international conference on knowledge discovery and data mining, 1135--1144.
Get the paid version of the course. This will give you access to the course eBook, certificate and all the videos ad free.